
Tree Whisperers: The Ins + Outs Of How Scientists Track The Health Of Colorado’s Forests
When people first hear that I am a scientist, they often assume that I work in a fluorescently lit laboratory with chemicals and test tubes. That’s not the case with the research I conduct for the Forest Inventory and Analysis (FIA) program. I spend the majority of my working hours in the woods, sometimes hiking several miles off-trail to reach a research site.
There’s a deep connection between humans and nature — one that’s intertwined with a spirit of adventure and grounded in science. With a field season that extends into the winter, my coworkers and I face all types of weather and wildlife, never quite knowing what obstacles lie ahead on any given day.
FIA is a national program, but CSFS manages most of the research plots in Colorado and Wyoming. Colorado has around 4,500 plots, far too many to tackle in a single year. We monitor one-tenth of the plots each year, meaning researchers return to the same plot once every 10 years. Over time, this process allows us to track changes in tree growth, changes in species composition and disturbances like wildfire and beetle damage.
The results of FIA data directly contribute to an improved understanding of Colorado’s forests. FIA data is open source. Scientists use this research to study a myriad of topics, from the shifting ecological ranges of edible plants to how drought affects tree growth and mortality. FIA data also informed the Colorado’s Forest Resources 2004-2013 report, which evaluated current issues our forests face, including damage from pine and spruce beetles and the connection between drought and the sudden decline of quaking aspen trees.
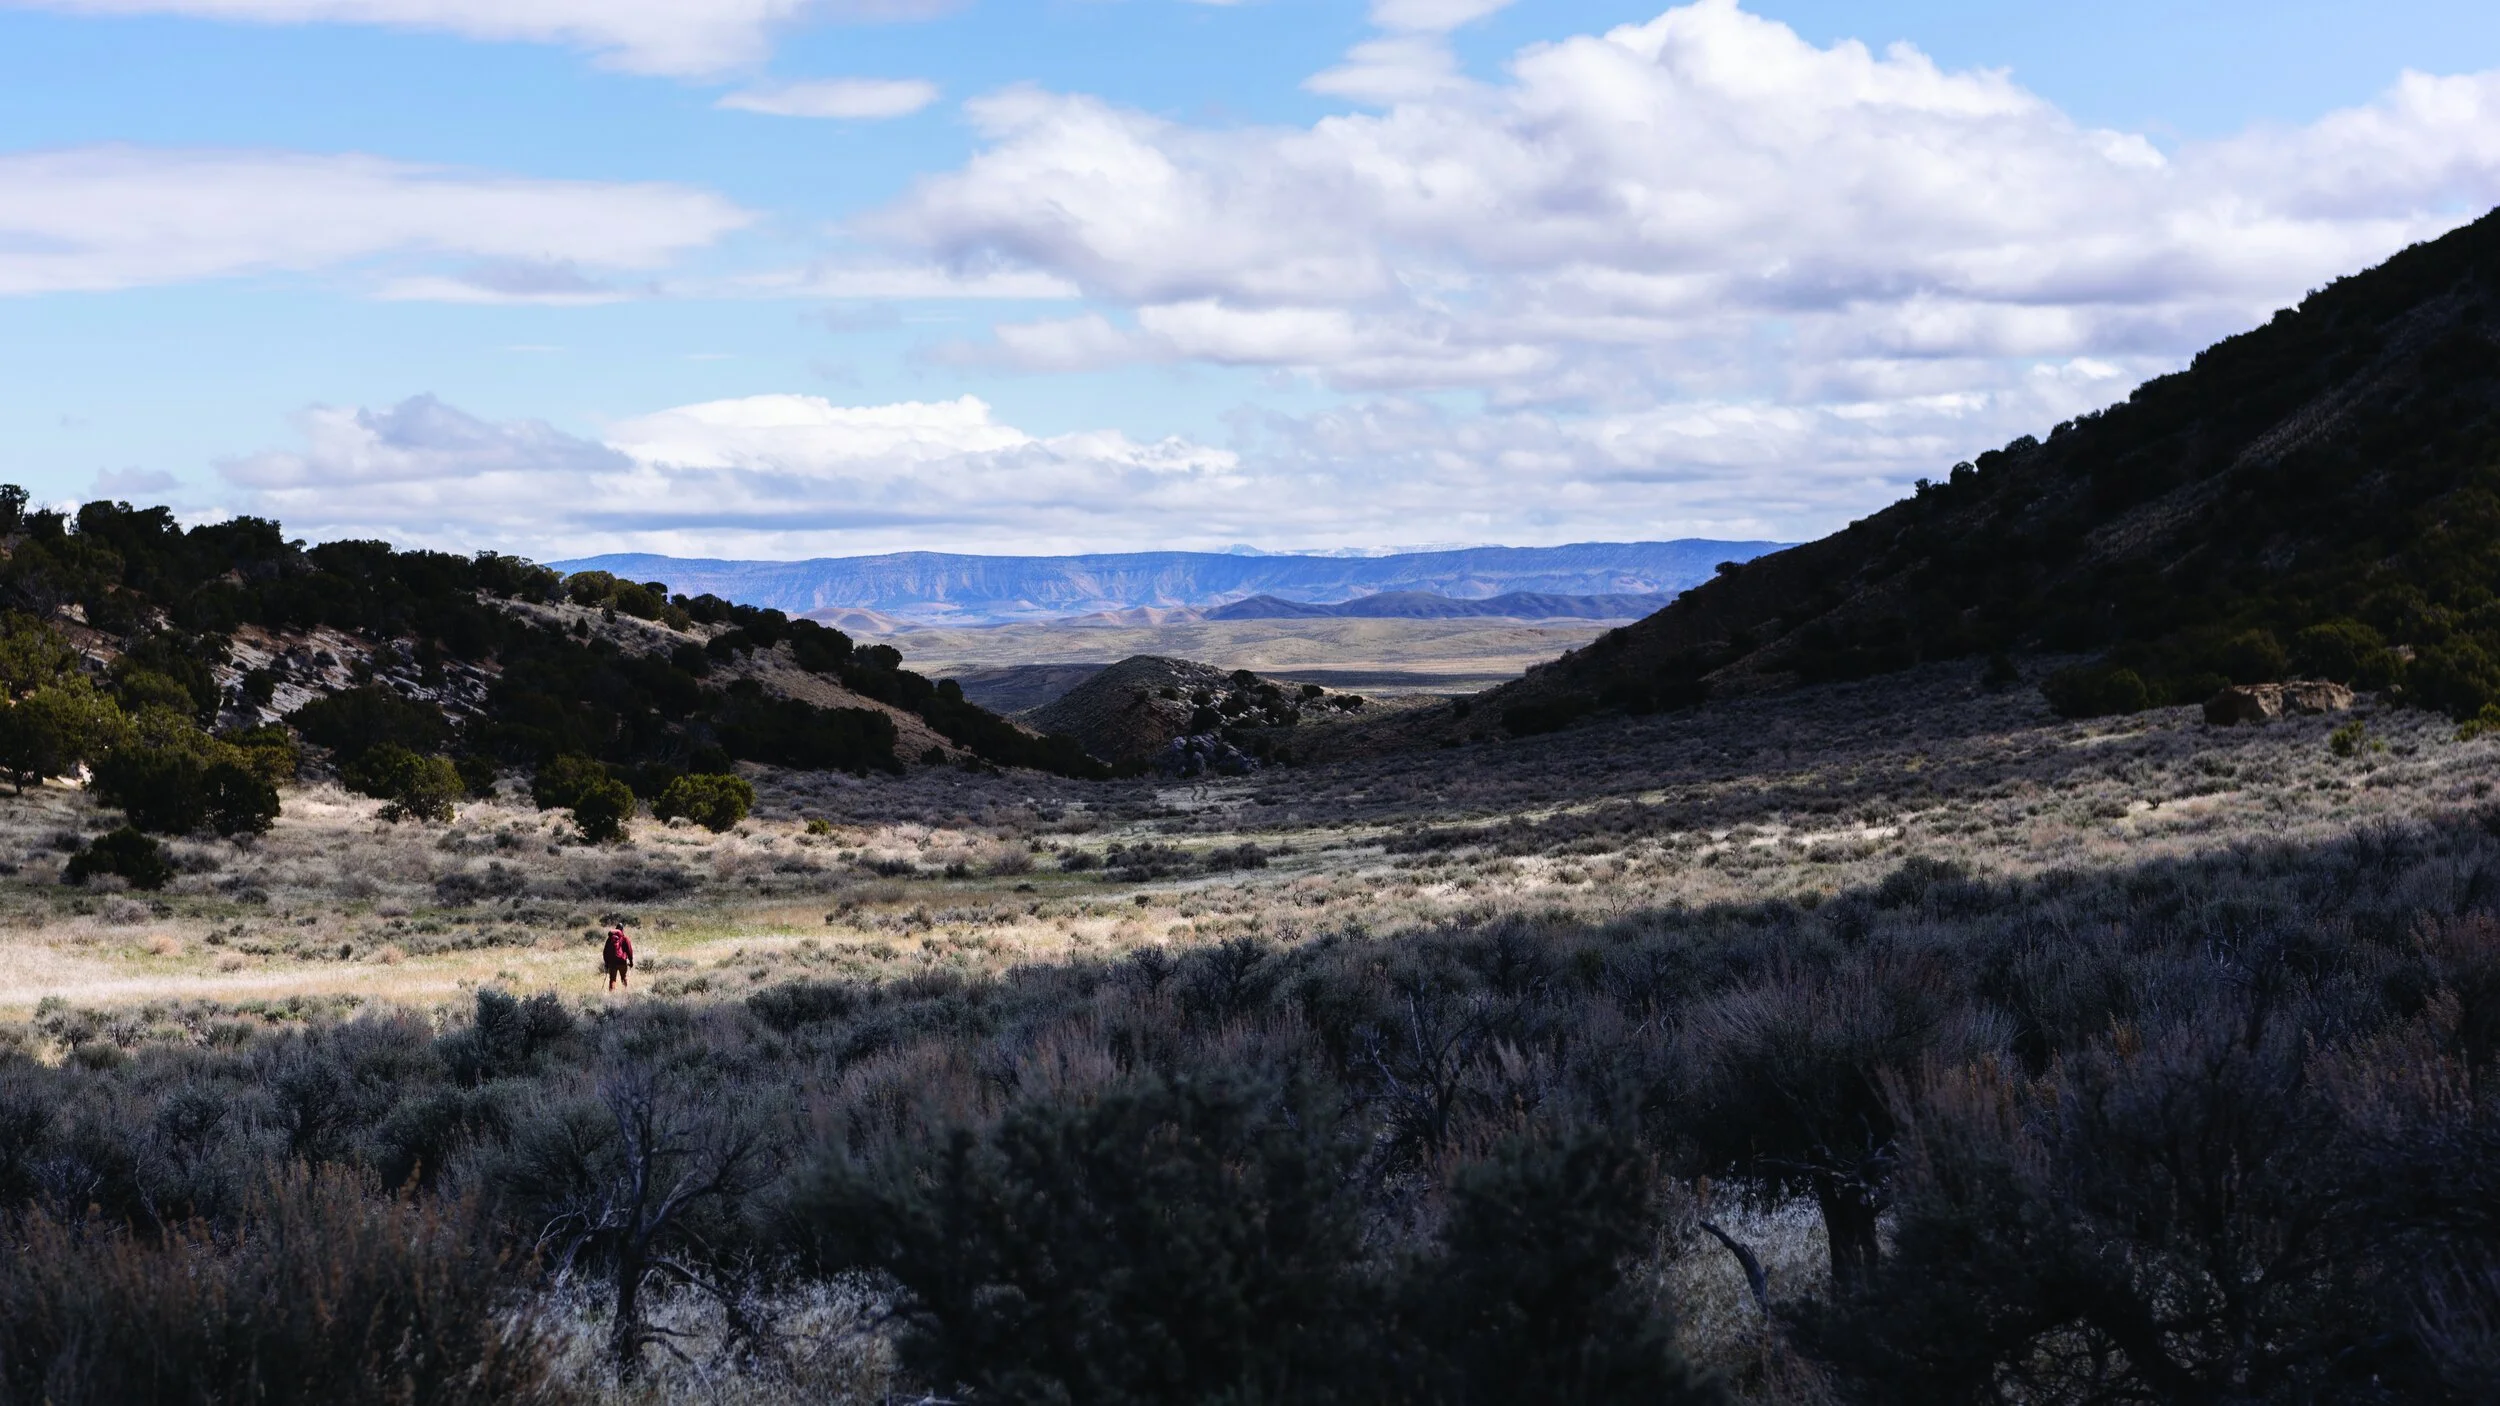
A coworker hikes through a secluded valley on his way to a research plot.

I encounter wildlife on the Western Slope almost every day. This time, a herd of wild horses kept me company while on a plot.

At the beginning of this project, the locations of the research plots were randomized. As a result, I often have to take the work truck off the beaten path before I can approach a plot on foot.

A coworker uses a compass to navigate across a plot. Tree azimuths in relation to subplot centers are also collected by compass, which helps future researchers to understand which tree is which.

A coworker wraps a tree with a diameter tape. Within a subplot, we record the diameter of a tree if it is greater than 5 inches at breast height (4.5 feet) or at its base, depending on the species.

Tree cores are another method to measure tree growth. Using an increment borer, the tool with the orange handle, my coworker removed a small segment of an Utah juniper tree and counted its rings to establish its age. Don’t worry, this doesn’t significantly damage the tree.

We also monitor and record understory vegetation. This is especially helpful for tracking invasive species, quantifying forage availability for wildlife and estimating the amount of burnable fuels should a wildfire emerge in the area.

My coworker evaluates the crown thickness on a stand of Utah juniper trees during heavy snowfall. If a tree has a thin or nonexistent crown, we evaluate what caused its decline. Fire and bark beetles are two common reasons for tree mortality on the Western Slope.
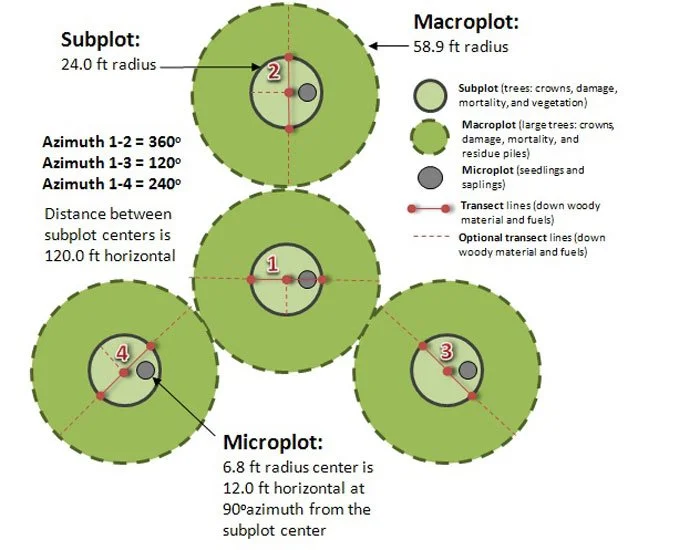
The structure of each research plot is identical, made up of four circular subplots, each of which has a radius of 24 feet. The same measurements are taken on each subplot. This figure is provided by the Colorado State Forest Service (CSFS).

Learn more about the FIA program in Colorado on the CSFS website.
Originally published in the summer 2025 issue of Spoke+Blossom.